"You can’t improve what you don’t understand.” – Avinash Kaushik
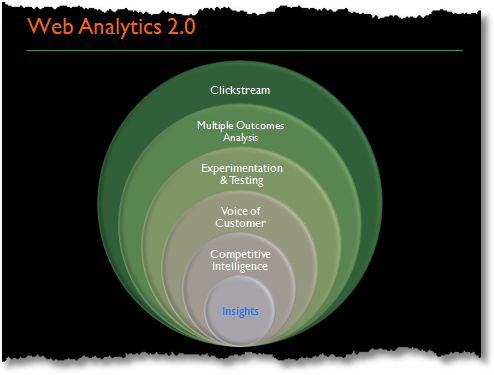
I've been reading a fantastic book this week that I highly recommend to anyone working within digital media analysis. Web Analytics 2.0, by Avinash Kaushik is a must-read for all online marketing professionals and business analysts.
Here's what I've taken away from my reading thus far:
Data is the anatomy of digital media. Within the structure of web platforms and online content is a wealth of information. It provides everything necessary to evaluate the sustainability of an online product. The challenge is not collecting data; but rather, in its evaluation and analysis. How and when decisions are made requires the right data at the right time. Timing is critical for proactive enhancements. By understanding the structure of digital media it is possible to improve the life of the product and the duration of its effectiveness.
The test and measure philosophy for success provides the awareness that no project is ever complete. It is crucial to acquire data that is actionable, and to discard data that is unhelpful or irrelevant. This principle seems simple, but assessing ‘good’ data from ‘bad’ data is unique to every web application, platform, and piece of content. Determining the KPIs (key performance indicators) requires trial and error.
Each individual within an organisation will have their own expectation for reporting based on their role and responsibilities. The role of the individual distributing these reports and evaluating them is determined by the company's corporate culture.
An administrator produces reports and distributes them to the individuals responsible for decision making. These managers evaluate the data and implement strategies based on the insights they extract. This causes delays and is not ideal for a start-up. A reporting system is better suited to a micro-management style of checks and balances, which slows down the decision making process.
The alternative is to employ an analyst who extracts insights based on their experience and industry knowledge. An analyst cuts down the time required for multiple individuals to reach a conclusion from the data. An analyst is suited to an agile development team that is trying to launch a new product. The difference is the speed in which decisions take place within the organisation. This report outlines the role of the analyst while detailing the necessary metrics to be collected and analysed.
Step 1: Customer Intent
This form of reporting is simple and standard with most analytics software. Essentially a few lines of code are added to each page; which is automatically generated by the analytics tool. This code will produce reports on general site-wide information, such as: page views and bounce rate. The core metrics listed above will be the basis for assessing the customer intent.

Step 2: Configure Settings
In order to asses “good” data from “bad” data the various conversion funnels will need to be stored within the analytics tool. These goals will allow us to determine how often a user performs specific actions that lead to positive outcomes; such as: completed registrations, subscribing to the newsletter, creating an ad, placing a bid, and even performing an internal search.
We need to capture the specific actions performed by each user in order to enhance and improve the sales funnel. Only through test and measurement of the online flows can processes be improved. If the majority of users are performing the same searches there may need to be a quick link provided upon point of entry to enhance the experience and serve relevant information directly.
Another important consideration is that not all actions will occur on the website. Thanks to open API's most users will be able to take action through external webpages and devices. Essentially, what the report needs to determine is how users are interacting with the platform (*think platform not website).
Step 3: Campaign Tracking
In order to accurately assess the ROI for online advertising and promotion it is critical that each and every Ad has a unique code associated with it. This includes emails, banners, referral links, and directory listings. The tag needs to include the location, source, and any other parameters surrounding the online marketing strategy for that particular promotion.
This requires time and a designated body assessing that the code is accurate and reports are verified. There are tools to help with the manual entry associated with campaign tracking, but it will require a person to manage and perform data entry.
It is very important to know where traffic is coming from and which referring websites are producing regular flows of traffic. The more relevant a promotion the higher the conversion rate which means a good return on investment. It’s important to determine which websites refer traffic based on internal search terms and top tags.
Step 4: Tracking Revenue & Intelligence
Additional JavaScript code will need to be embedded onto each page in order to extract data out of the page. The code will provide instructions for the script to know what data needs to be collected. Due to the fact that this data is personal and user generated it is important that all privacy measures have been taken into consideration. Legal evaluation of the data being collected is required; not only because of the user’s right to privacy, but because company data will be exported into an external tool and then processed into a report.
The value of this data is high and crucial for assessing gaps and accuracy of online forms, the payment gateway, and internal processes for user management. It is also required for measuring the payments being processed through your web platform.
Metrics to be collected include:
- Daily Payments
- Daily Fees Collected
Evaluating the effectiveness of rich media is paramount for any web 2.0 platform. Monitoring user interactions with content such as: videos, widgets, apps, audio, and any other user generated content. Developers will need to create and embed code into each piece of rich media content in order to track behaviour.
Reporting can include:
- How often a video is played.
- Viral distribution of content (sent via which aggregator)
- How often a user opens an app
- How often a user interacts via mobile device
- Action via Widgets and Gadgets
Analytics Resources:
Google Analytics Glossary
Occam’s Razor by Avinah Kaushik
Hitwise
comScore
“Let data, not opinions, drive decisions.” – Avinash Kaushik
No comments:
Post a Comment